발간보고서
home > 자료실> 발간보고서
- 글자크기
Guidance on Maximizing Launches in Brazil
| 작성자 | 관리자 | 카테고리 | 전문가 인사이트 |
|---|---|---|---|
| 작성일 | 2018-11-26 | 조회수 | 3,517 |
| 원문 | 한국보건산업진흥원 | ||
| 출처 | |||
Guidance on Maximizing Launches in Brazil
(exclusively for Khidi purposes)
Focus in Retail Market: Point of Sale, Trade, Distribution & Digital
Produced by: Fabio Augusto Deleuse
SP, October 8th, 2018
Index.…………………………………………………………………………...Page
Objective and method to capture and classify information….…...………….…..02
Key players and sources used……..……………………………………………..... 03
Concepts and topics surveyed……………………....…………………………….....03
Overview of the Pharma Market…...…………………………………….…………..04
Overview of the Retail Market…..……………………………………….…………...07
Outputs of the Digital Campaign..……………………………………………..…......10
Outputs of the Retail Market…….…………………………...………….…….……...11
CRM approaches for Trade and Retail……………………….……………….…....13
Projection of Investments (brief simulation)………...….……..………………….....15
Projection of Launch Volumes (brief simulation)…………………..………………17
Objective and method to capture and classify information:
The primary objective of such guidance is to provide, to interested partners, general inputs on pre-stocking, "replenishing" (1st purchase following pre-stocking), strategic initiatives and respective costs for trade marketing aiming at OTC Launches in the Pharma market (focusing on Trade & Digital). Besides that, the guidance also indicates main market practices and also suggest some best practices concerning:
A. Commercial conditions for pre-stocking
B. Formats and costs involved in potential Trade Campaigns
C. Additional requirements for successful launch
D. Average time required for replenishing following pre-stocking
E. Commercial conditions for resale
A central part of producing this guidance was to select target professionals and key players from the OTC/Pharma sector, and then gather strategic information, perspectives and opinions from all interviewed (purchasers, sales people, service providers) through a structured questionnaire.
In order to get to in-depth conclusions and insights, all the answers were divided in 3 different segments as described below:
A. “Bio Pharmacy Chains” with national coverage – direct sales, over 150 Points of Sale(POS)
B. “Medium Chains” with regional coverage – direct sales, from 40 to 150 PoS
C. “Small Chains” and local entitles – indirect sales(from wholesalers)
The previously described pharmacy chain segmentation is justified as we found out specific practices and procedures at each group that are significantly different among the 3 proposed segments.
The value and general inputs outlined at this guidance reflect the initial phase named “LAUNCH”, that comprises the decisive period of nearly 3 months following pre-stocking which will directly lead to initial understanding of demand and then the sales projections for the upcoming 2 years of the product launch.
This initial phase is divided by 2 steps:
a. Pre-Stocking;
b. Replenishing.
In each of the two steps mentioned above, there are distinct commercial practices, most importantly: payment terms. It is key to mention that, most PoS take a closer look at the two steps highlighted before taking any decisions on purchases and/or allocation of products.
This guidance should be faced as an initial and summarized analysis which may support better understanding of market dynamics as well as may lead to more accurate decisions on promotional efforts, costs/investments for the launch of innovative OTC products. At the end of the day, this guidance can potentially pave the way for future exercises of forecast e business planning grounded on broader and detailed feedbacks from customers, partners and key players in general from the target market. This can be particularly useful for international companies looking for investment opportunities in Brazil. The whole data gathered does not reflect entirely all commercial practices from the marketplace therefore should not be applied to other sectors or segments of the Pharma market (eg. Rx, BGx, Gx, OTX, HB), nor directly applied to OTC products without a clear uniqueness or innovation concept.
Key players (over #20 people) and sources used:
IQVIA Report - 30º IQVIA Advisory Board - SP - sep/2018
Abrafarma Reports
Febrafar Reports
Profarma S.A. Staff
Dimed-Panvel Staff
Drogasmil/ Farmalife Staff
Drogarias Venâncio Staff
A Nossa Drogaria Staff
Rede Tamoio Staff
CelleraPharma Trade Managers
Pfizer Consumer Health Trade Managers
Sanofi Trade Managers
Leading Digital Marketing Agencies (focused in Pharma market)
Concepts and topics surveyed:
Launch phase - period of 3 months comprising first purchase order, strategies and initiatives to foster demand generation, replenishing and finally definition of demand curve and positioning into the ABC curve of the hypothetical client/pharmacy.
Pre-Stocking - negotiation process preparing for the first order from a hypothetical client, definition of PoS clustering, individualisation of stocking in each PoS within the pharmacy chain, calculation of safety stock along the whole value chain and also listing of trade initiatives.
Replenishing – process of replenishing the regulator stocks and PoS stocks during the launch phase (first 3 months).
PoS clustering - process of putting together as a segment different PoS from the same pharmacy chain with the objective of standardizing as much as possible pricing, stocking, mix of products.
Individualisation of Stocking - definition of the exact amount of stocking/units of each product from the mix in the shelves of each PoS.
Mark up - mathematical index applied over the purchasing price in order to construct the final price at the PoS that will be visible to customers/patients/caregivers ("final price").
Penetration - probability of success in the process of pre-stocking during the first 3 months of launch.
Overview of the Pharma Market:
The pharmaceutical market in Latin America tends to sustain an annual growth rate of approximately 10% driven by the performance of Brazil within this region.
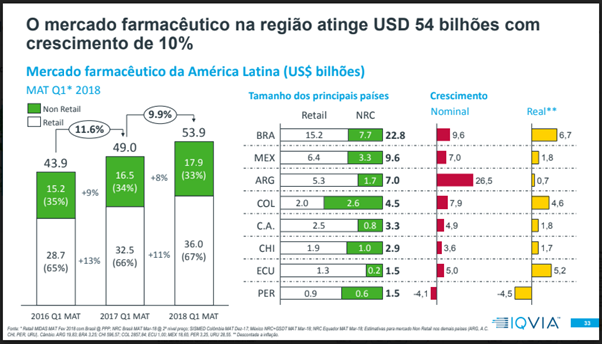
During the recent economic crisis (2015-18), Brazil was still able to catch up maintaining a positive growth in the past 4 years. The “retail” market within Pharma, represents the biggest part of the "pie" (comparing with "non-retail") and displays higher rates of growth. The table below was extracted from the most updated IQVIA Guidance which was presented in September 2018.
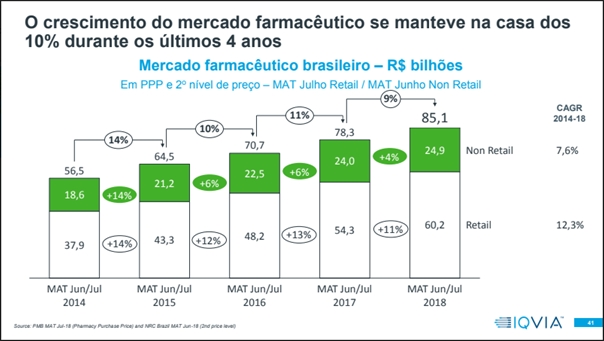
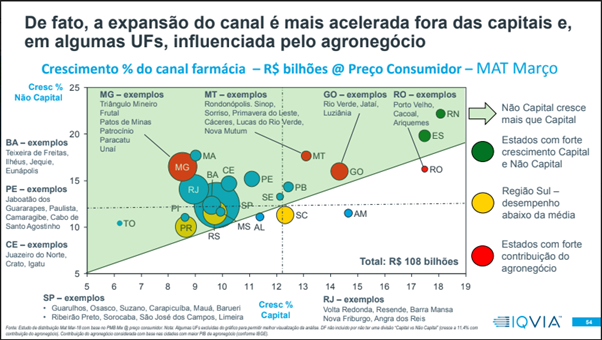
In order to further streamline effort and investment allocation, the graph below may be useful:
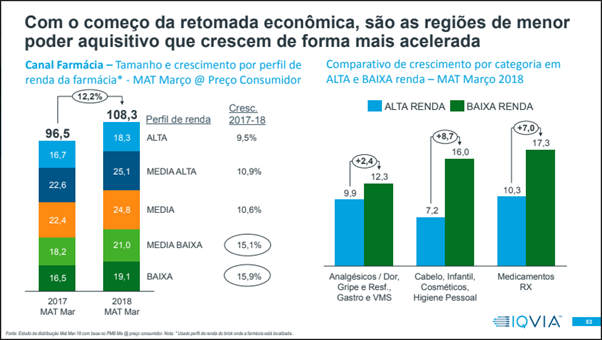
Worth noting, the opportunity for companies with focus in lower income classes in Brazil (classes C and D) as they have been displaying higher growth than higher classes:
Also important to review the significant growth of the OTC/CH Brand and OTC/CH Trade, as described in the earlier graph.
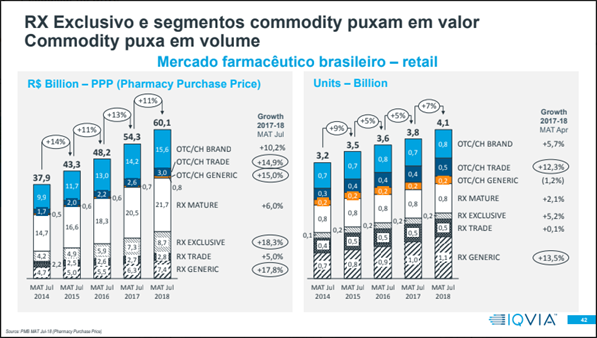
OTC and Consumer Health products are strongly share and growth in the this market:
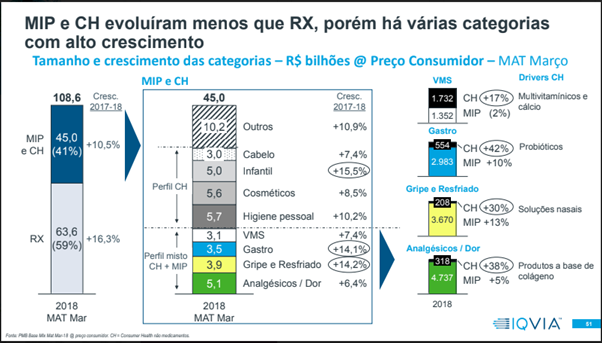
Overview of the Retail Market:
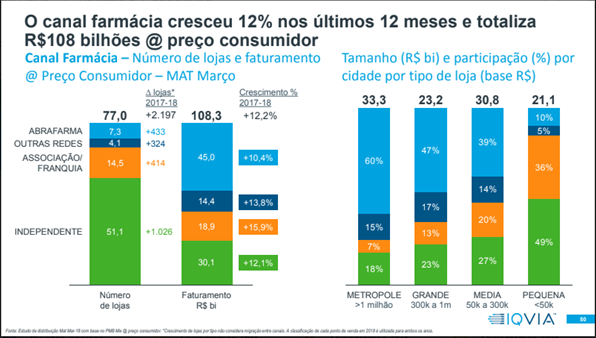
In recent years, the Retail market has gained relevance and power of influence in the value chain (pharma industry-distribution-retail). Nowadays, the Brazilian market has a remarkable quantity of PoS vendas (PoS – pharmacies), reaching the total number of 75.000-80.000 pharmacies in the country. Nonetheless, when one observes the concentration in terms of volumes and values purchased in the total market, one can directly perceive the consolidation movement that is occurring because approximately 20% of PoS account for 60% of the total value of the market. Please see more details below:
There are two main entities (associations) that defend the interests of the retail sector in the Pharma market. These entities work as "private clubs" with numerous members, sometimes sponsored by the Pharma Industry as they concentrate the most relevant players in the sector.
The two entities cited earlier are the following:
• Abrafarma (Associação Brasileira de Redes de Farmácias e Drogarias) - https://www.abrafarma.com.br/Representthepharmacychains.They are centrally managed and with own pharmacies, accounting for nearly 42% of the total market in values (R$ - local currency).
• Febrafar (Federação Brasileira de Redes Associativistas e Independentes de Farmácias) - http://febrafar.com.br/: Represents the business of associated entities with no central management, accounting for around 18% of the total market in values (R$ - local currency).
The table below showcases the list of the main big and medium size pharmacy chains of the Brazilian market (only the ones with centralized management), amounting to 6.498 PoS and consequently around 42% of the value market (R$ - local currency).
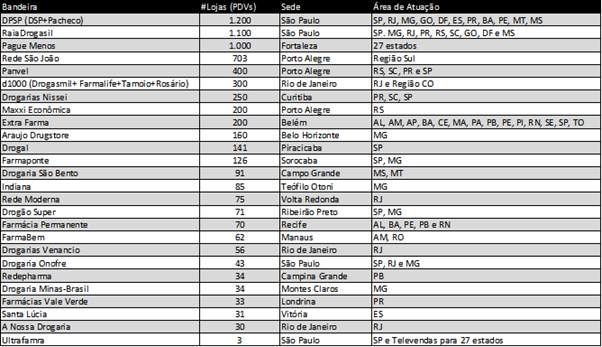
Sources: List of members of Abrafarma Dec/17, IMS - Guidance MDTR Feb/18 and Websites from pharmacy chains.
Please find below, the list of main associated entities (medium and small sizes) that are present in the Brazilian market (only franchises – not included the independent pharmacies), amounting to 9.696 PoS and approximately 18% of the value market (R$ - local currency).
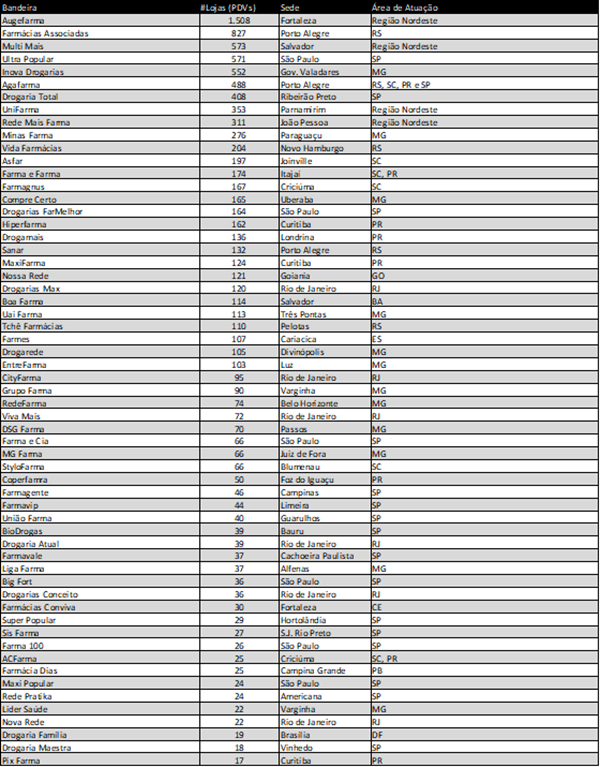
Sources: List of Febrafarma member in Jan/18 and Websites from associated entities.
Outputs of the Digital Campaign:
3 top-tier Digital Marketing Agencies, dedicated to the Pharma market, were interviewed with the objective of better understanding the major initiatives and resources required to put together a sound and solid Digital Campaign that would be able to become viral and drive demand consistently among end-users in the internet, e-commerce and social media.
As an important side note, Brazil is a highly connected country with very high engagement from the general population (regardless of social-economic profile) to social media and digital platforms.
Please find below a range of investments for the first year of launch of the OTC products. In general, a Digital Campaign Campanha for 6 OTC products should include the following:
-Website (with e-commerce): U$13-25k
-E-commerce only (in case the interested partner wishes to use its own website): U$12-15k
-Ads+SEO+Content: U$13-25k
-Bloggers: U$20-40k
In the exercise above the total investment would range between U$58k and U$105k depending on number of products in the e-commerce, frequency of posts, fee of bloggers and so on. Because the present guidance focuses in the "Launch Phase" (3 to 6 months) it is necessary to normalize the range of investment outlined earlier in light of the shorter period of time contemplated in the "launch phase" (around 50% of the range suggested, meaning: around U$29k to U$53k).
Outputs of the Retail Market:
For planning purposes and detailed analysis of profitability of the launches, most PoS and pharmacy chains conduct a mark up exercise which takes the purchase price (sell in), multiply a specific ratio or percentage (mark up) and then calculate the target final price to be visible to customers (comparing with the suggested final price by the manufacturer). There is another alternative for establishing pricing once the product has accumulated some past performance of sales which consists of classifying the product in the "ABC Curve of Demand"
For negotiation matters with pharmacy chains, once the manufacturer presents a product with unique features and a undeniable innovation per se, there is higher likelihood of classifying the launch product in the A category of the ABC upfront.
Also key to keep in mind, that hurdles to pre-stocking and pricing negotiations can be easen depending of the investment plan presented by the manufacturer. One of the investments that make pharmacy chain purchasers/managers' eyes shine is the Media Campaign (digital + social media + TV + radio). Any sort of institutional investments in the trade, involving merchandising, orientation in PoS and creative activations are very well perceived by the professionals interviewed for this guidance.
Top ranked activities:
● Radio and TV;
● Solid Digital Campaigns;
● e-Commerce linked to the pharmacy chain;
● Sales people within top-tier PoS
More detail information on the interviews follows:
1. “Big Pharmacy Chains” with national coverage.
Penetration Index - around 45%
Mark up - 50% to 70%
Clustering - around 25% of the total amount of PoS of the pharmacy chain
Individualisation of Stocking - around 6 units per PoS + regulator stocking of 30%
Commercial Conditions for pre-stocking (*) - Consignment inventory for 90-120 days with payment dependent on exact monthly evolution of sell out.
(*) in some cases consignment agreements can be compensated with free products.
Commercial Conditions for replenishing - 60 to 90 days for payment
Commercial Conditions for replenishing once the real demand is established - 45 to 60 days for payment
Trade investments for the launch phase - around U$215,00 per PoS per month
Observations:
Usually pharmacy chains develop their own trade campaigns until September timeframe and then negotiate with manufacturers during Sep-Dec timing so the best moment to negotiate pre-stocking of launches is eary in the year however exceptions can be done by pharmacy chains that open new "windows of negotiation" even during Q4.
Pharmacy chains are flexible to fund trade activities with additional benefits through mark up or free product.
2. "Medium Chains" with regional coverage
Penetration Index - around 72,5%
Mark up - 45% to 60%
Clustering - around 40% of the total amount of PoS of the pharmacy chain
Individualisation of Stocking - around 8 units per PoS + regulator stocking of 25%
Commercial Conditions for pre-stocking - Free products for the first 30 days (using sales projections from manufacturer)
Commercial Conditions for replenishing - 45 to 60 days for payment
Commercial Conditions for replenishing once the real demand is established - 45 to 60 days for payment
Trade investments for the launch phase - around U$180,00 per PoS per month
Observations:
Many of these chains also develop their own trade campaigns however in most cases there is reasonable flexibility to negotiate spot activities and also other joint activations.
3. "Small Chains" and local entities (indirect sales)
Penetration Index - around 17,5%
Mark up - 30% to 40%
Clustering - around 50% of the total amount of PoS of the pharmacy chain
Individualisation of Stocking - around 2 units per PoS without any regulator stocking
Commercial Conditions for pre-stocking - payment term of 45 to 60 days (with an option to postpone)
Commercial Conditions for replenishing - 35 to 45 days for payment
Commercial Conditions for replenishing once the real demand is established - 30 to 45 days for payment
Trade investments for the launch phase - around U$50,00 per PoS per month
Observations:
For this kind of pharmacies the sale tends to be indirect what can potentially lead to additional payment terms or financial compensation for the wholesaler commercializing with the specific pharmacy.
It is essential to count on a well trained trade team supporting this sort of pharmacy, the referred team can be either internal, shared or outsourced by the interested partner.
4. Distribution
Condition for pre-stocking: a. consignment agreement which enables adequate volumes in wholesalers; b. payment terms of 90 to 120 days along with a detailed action plan to realize demand (eg. prospects, sales force promotion and coverage, one-time commitments), c. condition for replenishing: depends on the total target volume but should be close to 45 and 60 days for payment terms (regulator stock anywhere of 35-45 days).
5. DigitalChannel
It considers only sales through e-commerce within a dedicated website platform regardless of being own or outsourced. This channel could represent around 30% of total pre-stocking of pharmacy chains, however this can vary significantly based on product profile, level of investments in digital and initial awareness of users about the concept.
It is fair to expect that the regulator stock could last for the period of 3 months that is called in this guidance as "launch phase".
CRM approaches for Trade and Retail:
More important than simply implementing a set of activities, the trade structure is built up to organize and prioritize efforts and resources dedicated to the PoS that will likely generate better returns. It is instrumental to develop and assign early on a set of financial and business rules that need to be strictly followed by all involved. There are a few criteria that help us drive better returns out of a trade plan: relevance of the pharmacy chain or wholesaler (critical mass) and engagement (drive in the execution).
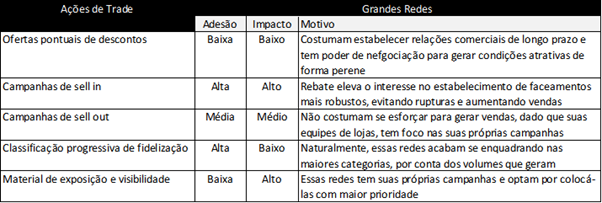
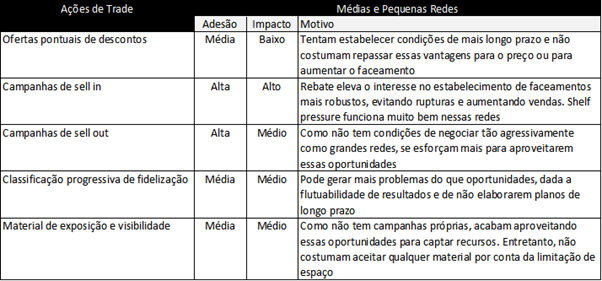
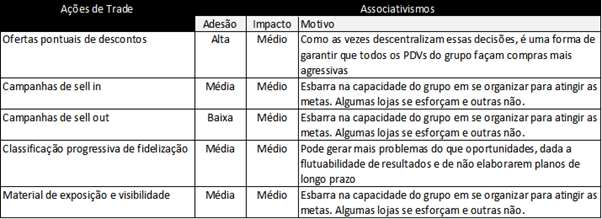
One can divide the business models in two different types of campaigns:
a. Pharmacy Chain Campaigns – They are frequently created and developed by big chains like DPSP, RaiaDrogasil, Pague Menos and other entities Max, Farma & Cia and others. The natural path is that the pharmacy offers different options of sponsorship packages ("gold", "silver", "bronze") to specific pharmaceutical companies from top multinational ones till small national companies. The costs associated with such sponsorships can vary greatly and in some cases reach the amount of millions of R$ (local currency) or hundreds of thousands U$.
b. Pharma Industry Campaigns – They are frequently created and developed by the marketing departments of the pharmaceutical companies with the objective to speed up sales performance and demand of a specific product, a line of products or even the whole portofolio of the given company. Such campaigns can focus in exposition or visibility of the products, the latter is divided in:
i. One-time discount offers or special payment terms
ii. Sell in campaigns (purchase) with extended payment terms
iii. Sell out campaigns (demand) with extended payment terms
iv. Progressive loyalty campaigns
v. Materials for better exposition and visibility of products at the PoS
Observation: Generally, the above mentioned divisions are offered as a full pack or with some interconnections in order to generate higher returns: sales, coverage, stock, visibility of the products at PoS.
As important as defining the right set of investments is to segment the right pharmacy chains and wholesalers to whom offer every and each of the campaigns, so below there are a few tables in the sequence describing what kind of investments may generate higher returns and why depending on the specific entity: big chains, medium chains, small chains, local entities and also independent PoS.

Projection of Investments (brief simulation):
For this specific simulation, it has been used a coverage of only 60% of the Brazilian market, using assumptions and strategic information provided by key players from pharmacy chains, wholesalers and other strategic partners. On top of that, for forecasting purposes it has been also taken into consideration activities in digital as this should be key for the success of OTC products.
It is worth mentioning that any investment in trade is good enough for a line of products and not only one product or SKU what is decisive from a planning and financial standpoints.
Institutional Trade Campaign (65% of total value in the case of period of 6 months)
U$37k - U$70k for 6 months
Trade Campaign for big chains - 5.513 PoS
|
Topics |
Average (survey) |
Pre-Stocking |
x6 SKUs |
|
Penetration |
45% |
2.481 PoS |
N/A - Fixed |
|
Clustering |
25% |
620 PDVs |
N/A - Fixed |
|
Stocking (PoS + 30% Regulator) |
6 units per PoS |
3.720 units |
29.016 units |
|
Required investment in case of absense of a Digital Campaign |
U$215k per PoS |
U$130k |
N/A - Fixo |
|
Required investment in case of an existent Digital Campaign |
Reduction of around 25% in the above investment |
U$99k |
N/A - Fixed |
Observation: Sales projection for the replenishing phase will directly depend on the product performance in the first months of launch as well as the investment level of the interested partner. In terms of investment level, it is reasonable to expect that the maintenance of the investment level for at least 3 months.
Trade Campaign for medium chains - 985 PoS
|
Topics |
Average (survey) |
Pre-Stocking |
x6 SKUs |
|
Penetration |
72,5% |
714 PoS |
N/A - Fixed |
|
Clustering |
40% |
286 PoS |
N/A - Fixed |
|
Stocking (PoS + 30% Regulator) |
8 units per PoS |
2.860 units |
17.160 units |
|
Required investment in case of absense of a Digital Campaign |
U$180k per PoS |
U$52k |
N/A - Fixed |
|
Required investment in case of an existent Digital Campaign |
Reduction of around 25% in the above investment |
U$39k |
N/A - Fixed |
Observation: Sales projection for the replenishing phase will directly depend on the product performance in the first months of launch as well as the investment level of the interested partner. In terms of investment level, it is reasonable to expect that the maintenance of the investment level for at least 3 months.
Trade Campaign for small chains - 9,696 PoS
|
Topics |
Average (survey) |
Pre-Stocking |
x6 SKUs |
|
Penetration |
17,5% |
1.697 PoS |
N/A - Fixed |
|
Clustering |
60% |
1.018 PoS |
N/A - Fixed |
|
Stocking (only PoS) |
2 units per PoS |
2.036 units |
12.216 units |
|
Required investment in case of absense of a Digital Campaign |
U$50k per PoS |
U$50k |
N/A - Fixed |
|
Required investment in case of an existent Digital Campaign |
Reduction of around 25% in the above investment |
U$35k |
N/A - Fixed |
Observation: Sales projection for the replenishing phase will directly depend on the product performance in the first months and also on the level of stocking from wholesalers (direct sales). In terms of investment level, it is reasonable to expect that the maintenance of the investment level for at least 3 months.
Considering a perspective of indirect sales of 2.036 units of pre-stocking, one should think in a total stocking of at least 6.108 units in the distribution channel (3x - because of the overlap of wholesalers and target levels of regulator stocking in each distribution center in each geography of the entire country).
Projection of Launch Volumes (brief simulation):
The table below projects the needed stocks for pre-stocking + 4 months of replenishing:
|
Channel |
PoS Stock |
Regulator Stock |
Total Stock |
|
Big Chains |
3.720 |
1.116 |
4.836 |
|
Medium Chains |
2.288 |
572 |
2.860 |
|
Small Chains |
2.036 |
0 |
2.036 |
|
Distribution |
0 |
6.108 |
6.108 |
|
Digital (30% of retail) |
2.413 |
0 |
2.413 |
|
Pre-Stocking |
18.253 |
||
|
Stock at the Interested Partner 20% of pre-stocking x4 (Lead Time:120 days) |
0 |
14.602 |
14.602 |
|
Total Volume to be initially purchased by the Interested Partner > DirectSalud/ABC |
32.855 |
||
(*)simulation per SKU
Observations & Assumptions:
-First Quarter Demand = 20% of pre-stocking each month (assuming no progression in the demand).
-Lead time DirectSalud/ABC Farma (exWorks + local value chain) = 120 days / (1st order = 150 dias)
- 이전글 이전글이 없습니다.
- 다음글 다음글이 없습니다.


